Balance Sheet
Updated 31 October 2026
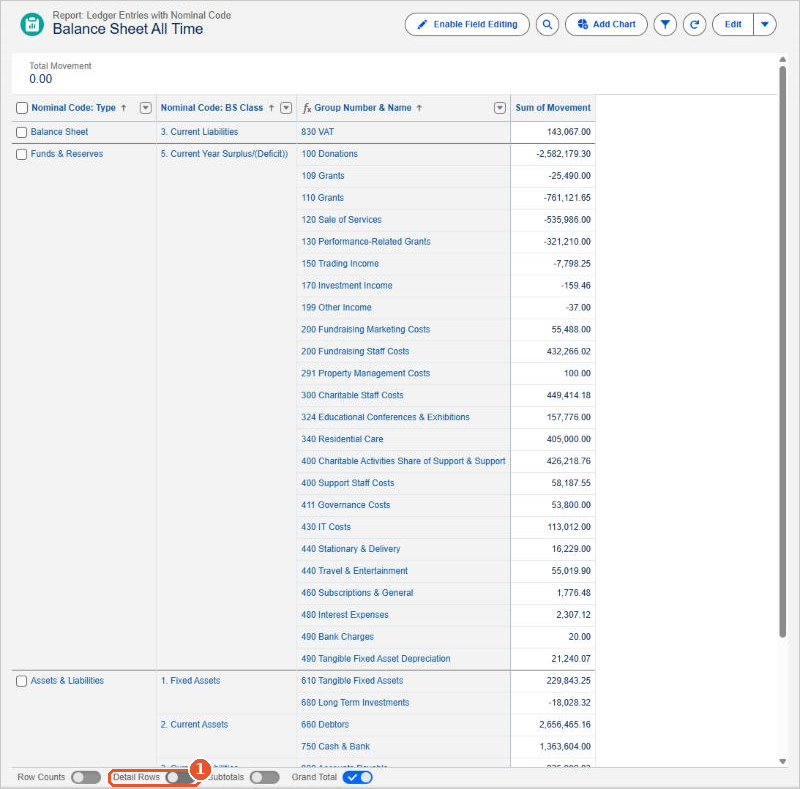
The Balance Sheet All Time report shows what the organisation owns and owes on a chosen date. It is grouped by nominal code Type, then BS Class, then nominal code group:
- 1. Fixed Assets
- 2. Current Assets
- 3. Current Liabilities
- 4. Long Term Liabilities
- 5. Current Year Surplus/(Deficit): the surplus or deficit from your income and expenditure
The Total Movement at the top is always 0.00, because the debits and credits balance.
Run the report
Click the Reports tab (or search for Reports in the App Launcher) and click All Folders. Open the SORP folder, then the Business Financial Reports folder and click the report name.
Click Balance Sheet All Time.
Choose the balance sheet date
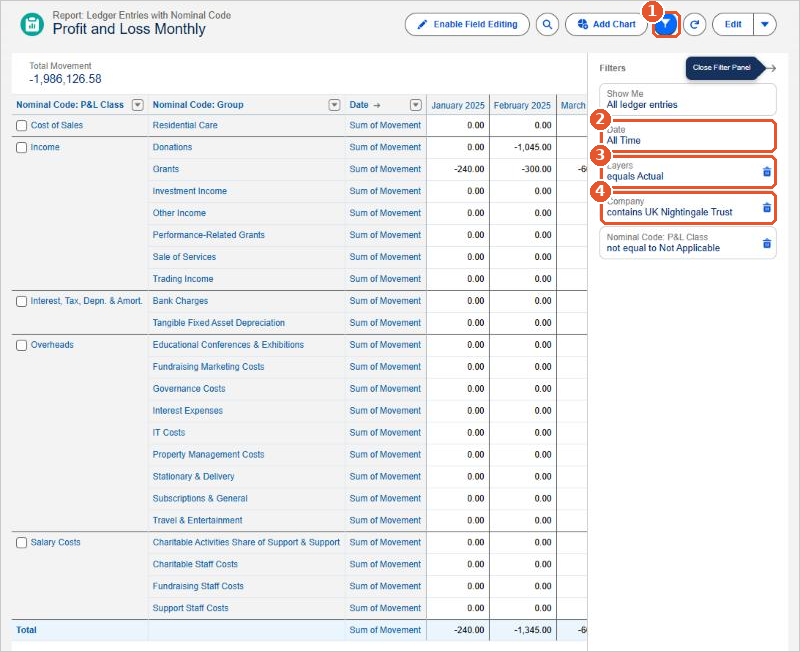
- Click the filter button(1) at the top of the report to open the Filters panel.
- Click the Date filter(2).
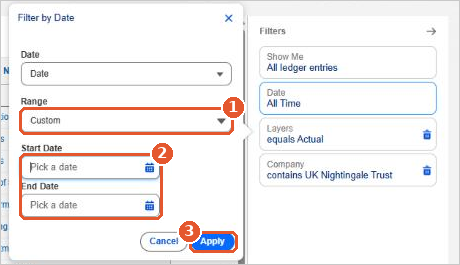
In the Filter by Date window, set Range to Custom(1), leave Start Date empty, and enter the balance sheet date in End Date(2). Click Apply(3). The filter then shows, for example, On or before 31 Mar 2026.
Filters are not saved
Changing a filter only changes what you see now. The next time you open the report, it uses its saved filters again.
Monthly movements
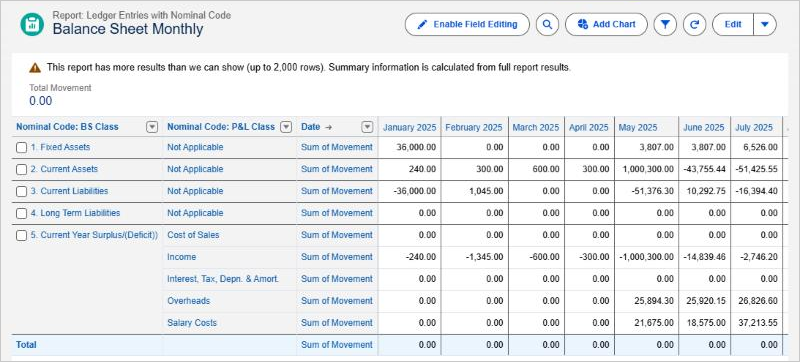
The Balance Sheet Monthly report, in the same folder, shows the movement on each BS Class for each month. Use it to see how the balance sheet changed from month to month.
Export the report
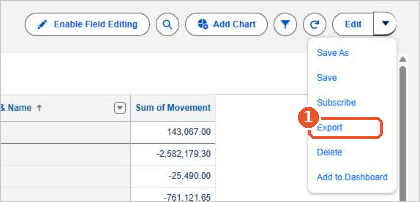
Click the arrow next to Edit and choose Export(1). Choose Formatted Report to keep the layout and totals, or Details Only for the rows of data, then click Export.
Salesforce help
These are standard Salesforce reports. For more about using them, see Salesforce’s own help: